|
Working with Graphics |
| |
| Insert Charts |
| |
| Charts are a good way to present data in an easy-to-understand manner. |
| |
| If you're working on different reports, you will almost want to include a chart in your document. |
| |
| Create a chart in Microsoft Word 2007 is very easy. Simply follow these steps: |
| |
| 1. Position your cursor where you would like to insert the chart |
| |
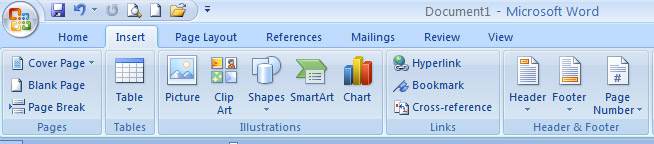
| 2. Open the Insert ribbon |
| |
 |
| |
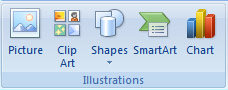
| 3. Click Chart in the Illustrations section |
| |
 |
| |
| 4. Select the style of chart you would like to insert |
| |
| For Animated presentation Click here |
| |
| |
|
| |