| Tracing, Debugging and Error Handling Techniques |
| |
| Debugging in ASP.NET 2.0 |
| |
| There are may be a number of mistakes you can make when you code your program, no matter how skilled you are. It is very difficult to track down the problem in your code. Luckily the .NET Framework SDK includes a lightweight debugger that is perfectly suited for this task. Together with Tracing and Exception Handling you're armed and ready. |
| |
| Types of Errors |
| |
| There are several kinds of mistakes you can make and they are listed below: |
| |
⢠Syntax Errors
⢠Logic Errors
⢠Runtime Errors |
| |
| Syntax Errors |
| |
| Such types of errors are commonly find in code of fresher programmers and also can be possible in code of experienced programmer. This type of mistakes is the easiest one to find: syntax errors. These are errors against the syntax of a particular programming language (in this case C#). Visual Studio underlines syntax errors at design time and provides a tooltip with some extra explanation. If you happen to miss out an error and try to compile, you'll get an Error List (or View > Error List) with all the errors in it. Double clicking an error will bring you to the line that has to be corrected. |
| |
| Logic Errors |
| |
| The second type of mistakes is logic errors. Since code is written but logic of code or set of rules to result a specific output is not as desired, so the program can complied with showing any information about the logic errors. Due to this nature of these errors it is difficult to trace them. Logic errors will not cause the program to stop working, but it can produce incorrect data that may not be immediately recognizable. The mistake could be a logical error in a statement, algorithm or even selecting the wrong method. To debug these types of errors you'll have to output the program's variables to a file or on the screen. It might even be necessary to place breakpoints and run through the code line by line. |
| |
| Runtime Errors |
| |
| The last group of mistakes is runtime errors. Runtime errors will cause the program to stop working. Some of these errors will have to be repaired (e.g. null pointers) and others should be caught with Exception Handling (e.g. parse error in a string when you want an integer). |
| |
| Debug Configuration |
| |
| To enable debugging you'll have to add following line between the configuration tags in your Web.config file: |
| |
| <compilation debug="true" /> |
| |
| If you didn't add the line to your Web.config file yet, Visual Studio will ask to do it for you the first time you hit F5 (or Debug > Start Debugging). Be sure to disable this setting when you put your Web site in production because it can significantly affect application performance. |
| |
| Breakpoints |
| |
| A breakpoint is a line in your code where the execution of the application is temporarily interrupted. Note that the program is interrupted just before that line is executed, not just after. To place a breakpoint click in the Margin Indicator bar next to the line of code or select the code and hit F9 (or Debug > Toggle Breakpoint). When you hit F5 to debug, the application will halt at the breakpoint. |
| |
| It is possible to assign advanced settings to a breakpoint by opening the breakpoints window (Debug > Windows > Breakpoints). You can assign a condition under which the breakpoint is hit when the breakpoint location is reached. If the expression is true or has changed then the application will interrupt, otherwise it will continue. Another possibility is counting the number of breakpoint hits and break at a certain number (or multiple of that number) or each time after a certain amounts of hits has been let through. It's also possible to print a message or run a macro with these advanced breakpoints. |
| |
| Break mode commands |
| |
| List of some useful commands available on the toolbar and in the Debug menu while in break mode is given below: |
| |
⢠Start/Continue (F5, Debug > Start): start or continue executing
⢠Stop Debugging (Shif+F5, Debug > Stop Debugging): completely stop debugging/executing
⢠Restart (Ctrl+Shift+F5, Debug > Restart): restart from the beginning
⢠Step into (F11, Debug > Step into): execute the code line by line
⢠Step over (F10, Debug > Step over): execute current procedure line by line but don't step into called procedures
⢠Step out (Shift+F11, Debug > Step out): execute whole procedure at once |
| |
| Debugging windows |
| |
| Break mode is often used to print and follow values of the variables and expressions. This can be done in several ways, only a few will be explained here. The easiest way is to hover over the variable and it will show the current assigned value and most of the time extra properties (hidden under a + sign). |
| |
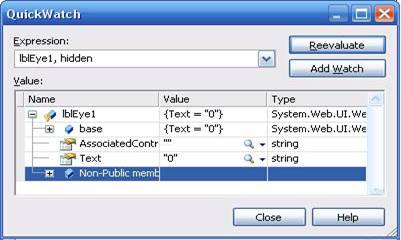
| The first real window is the Quick Watch which shows up with Ctrl+Alt+Q (or Debug > Quick Watch). In this window it's possible to quickly check and if needed change the value of a variable. It's also possible to add another variable or calculate an expression. |
| |
 |
| |
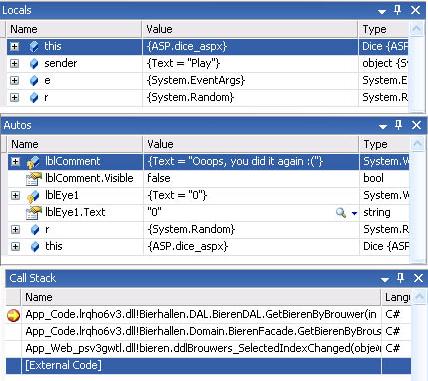
| The Autos Window (Ctrl+Alt+V,A or Debug > Windows > Autos) shows the variables in the active statement and the previous code line. The Local Window (Ctrl+Alt+V,L or Debug > Windows > Locals) shows the variables in the current procedure/form. You never know you'll find your mistake while checking the flow of the program. For this purpose you have access to the Call Stack Window (Ctrl+Alt+C or Debug > Call Stack) which follows the flow of the program and shows info on every function call. Every single window has his strengths in certain cases. It's up to you to choose the right window for the right job. |
| |
 |
| |
| Trace |
| |
| Trace is a performance tool that gives you a better way to examine that how a page works. In the trace log you can find everything that has to do with the current page covering things like execution time, every single control with their hierarchy and viewstate, header collections and server variables. And next to all of this you can add your own comments in the trace log thanks to Trace.Write() and Trace.Warn(). This might be useful to see what happens between two of your own comments. |
| |
| You can enable Trace on page level by adding Trace=true in the page directive or on application level with the following lines in your web.config file: |
| |
<configuration>
<system.web>
<trace enabled="true" localOnly="true"/>
</system.web>
</configuration> |
| |
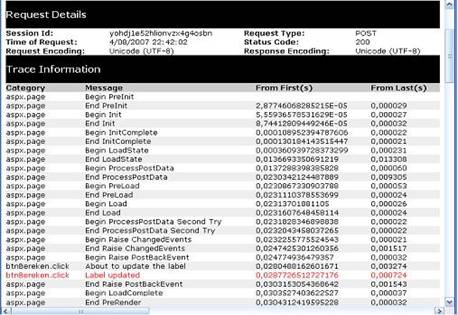
| In the figure given below you can see the source of a button click event where output to the trace log is added at the top and the bottom of the event code. Underneath the source code fragment you have a part of the trace log itself as it is generated after you clicked the button. You notice both entries in the trace log that were created by the code. |
| |
protected void myButton_Click(object sender, EventArgs e)
{
Trace.Write("myButton.click", "About to update the label");
int x;
x = int.Parse(txtGetal.Text);
for (int i = x; i >= 0; i--)
x *= i;
label.Text = PrintText(x.ToString());
Trace.Warn("myButton.click", "Label updated");
} |
| |
 |
| |
|
| |